One significant change in the Arctic region in recent years has been the rapid decline in perennial sea ice. Perennial sea ice, also known as multi-year ice, is the portion of the sea ice that survives the summer melt season. Perennial ice may have a life-span of nine years or more and represents the thickest component of the sea ice; perennial ice can grow up to four meters thick. By contrast, first year ice that grows during a single winter is generally at most two meters thick.
Below is an animation of the weekly sea ice age between 1984 and 2016. The animation shows the seasonal variability of the ice, growing in the Arctic winter and melting in the summer. In addition, this also shows the changes from year to year, depicting the age of the sea ice in different colors. Younger sea ice, or first-year ice, is shown in a dark shade of blue while the ice that is four years old or older is shown as white. A color scale identifies the age of the intermediary years.
A graph in the lower, right corner the quantifies the change over time by showing the area in millions of square kilometers covered by each age category of perennial sea ice. This graph also includes a memory bar – the green line that here represents the current maximum value seen thus far in the animation for the particular week displayed. For example, when showing the first week in September, the memory bar will show the maximum value seen for all prior years’ first week of September since the beginning of the animation (January 1, 1984).
Correction: The original release on 10/28/2016 incorrectly labeled the oldest category on the graph as “5+”. This was corrected to read “4+” on 10/30/2016.
This visualization shows the age of the Arctic sea ice between 1984 and 2016. Younger sea ice, or first-year ice, is shown in a dark shade of blue while the ice that is four years old or older is shown as white. A bar graph displayed in the lower right corner quantifies the area in square kilometers covered by each age category of perennial sea ice.
This visualization is the same as the one above, except that the areas where no data is available are displayed in the first 330 frames.
This animation is the same as the one above, except that the animation begins in January of 2000.
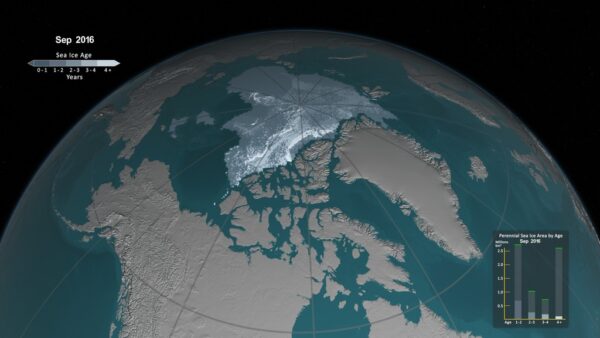
A still image of the sea ice age for week 37 of 2016 with a graph overlay showing the remaining millions of kilometers of sea ice by age.
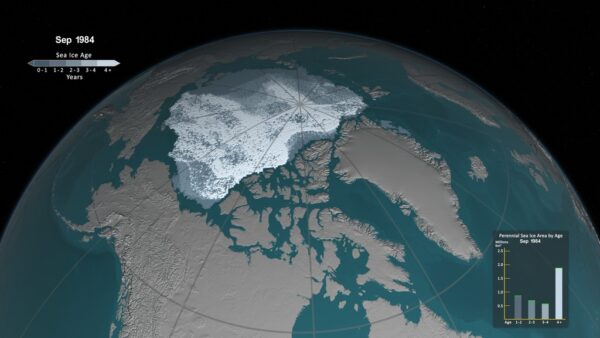
A still image of the sea ice age for week 37 of 1984 with a graph overlay showing the remaining millions of kilometers of sea ice by age.
The weekly sea ice age without the graph overlay.
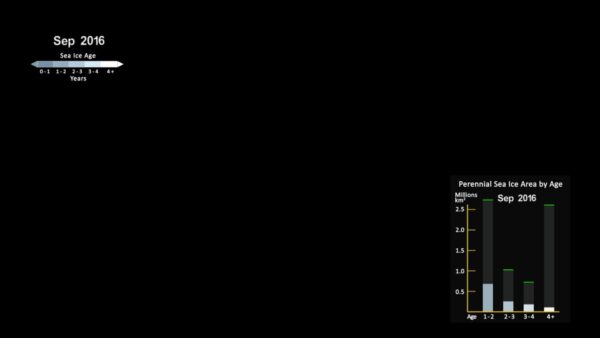
The overlay with the graph of the annual sea ice minimum showing the perennial sea ice by age in square kilometers with transparency.


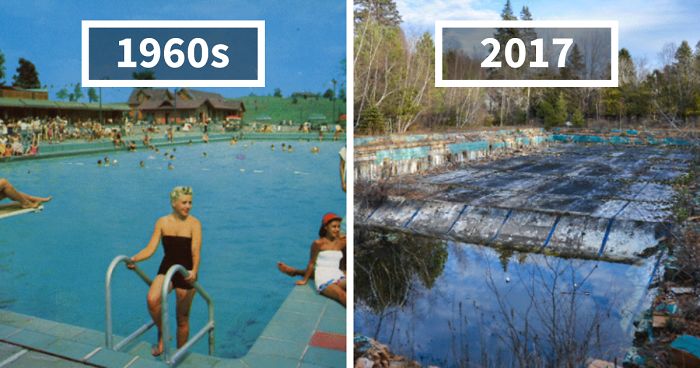 Photographer Finds Locations Of 1960s Postcards To See How They Look Today, And The Difference Is Unbelievable
  Hij zet 3 IKEA kastjes tegen elkaar aan en maakt dit voor zijn vrouw…Wat een gaaf resultaat!!
 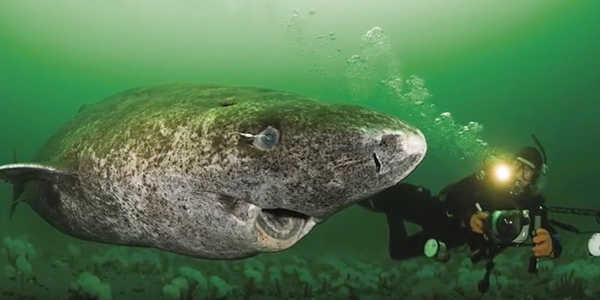 Scientists Discover 512-Year-Old Shark, Which Would Be The Oldest Living Vertebrate On The Planet
  Hus til salg er kun 22 kvadratmeter – men vent til du ser det indvendigt
 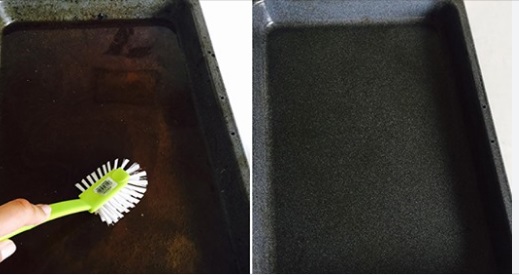 Superknepet – så blir snuskiga ugnsformen som ny igen!
 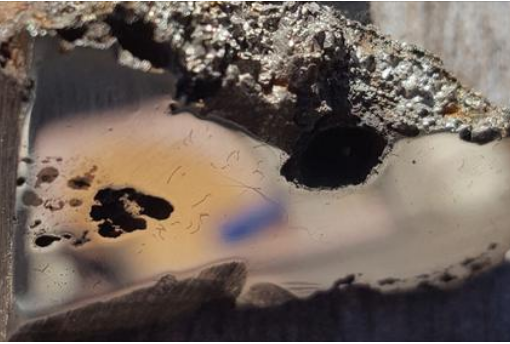 Meteorite That Recently Fell in Somalia Turns Out to Contain Two Minerals Never Before Seen on Earth
 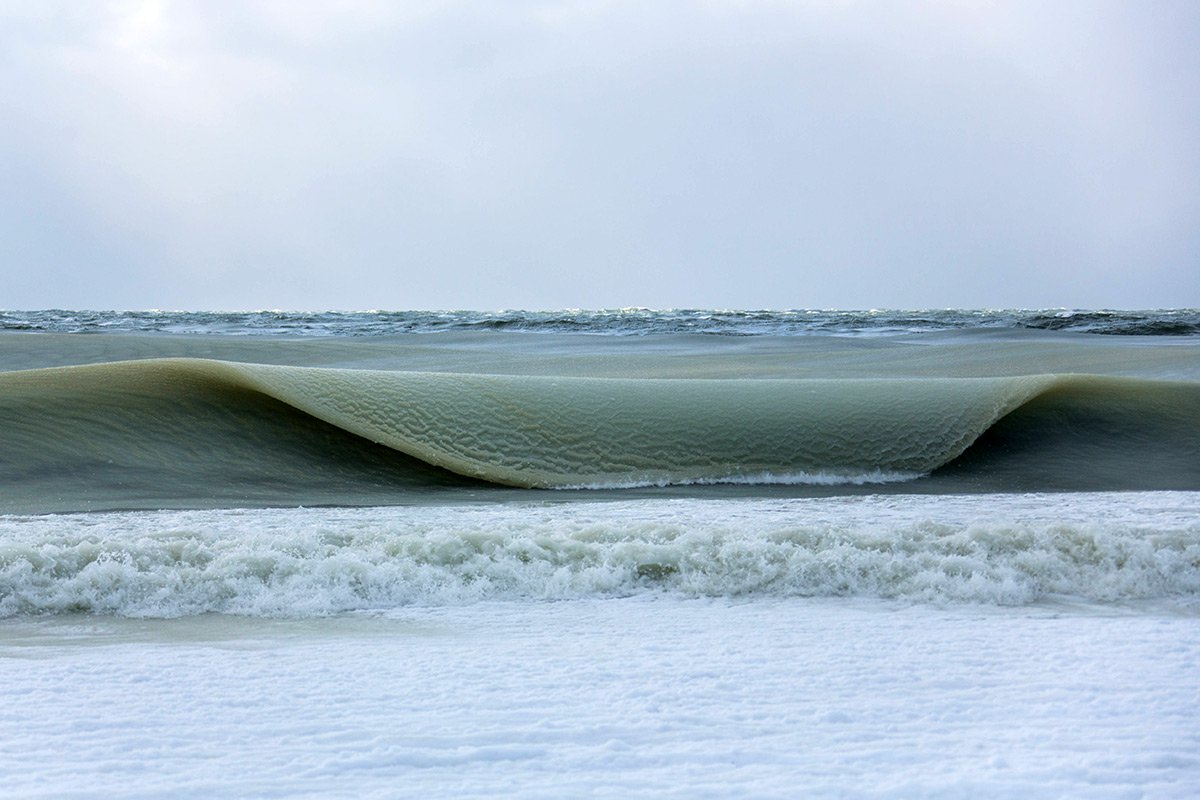 Nearly Frozen Waves Captured On Camera By Nantucket Photographer
 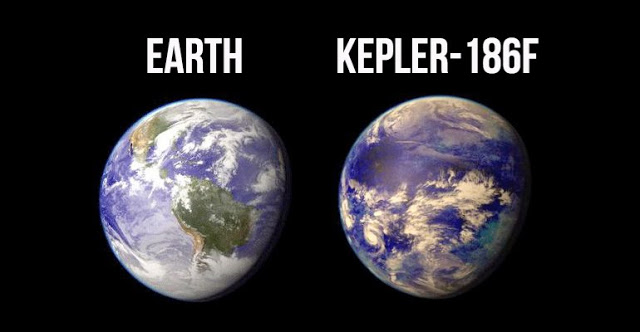 It’s Official: Astronomers Have Discovered another Earth